![]()
Bell态和GHZ态
Bell态
量子Bell态,是量子力学中一个非常重要的概念,通常用来展示量子纠缠的特性。Bell态广泛应用于量子通信、量子计算和量子密钥分发等领域。
Bell态的定义
在两个量子比特的系统中,存在四个最大纠缠态,通常称为Bell态。这些状态可以由任意一对量子比特构成,具体表达式如下:
|Φ^+⟩ = \frac{1}{\sqrt{2}} (|00⟩ + |11⟩)
这个状态表示两个量子比特处于同时是0和同时是1的叠加状态。
|Φ^-⟩ = \frac{1}{\sqrt{2}} (|00⟩ – |11⟩)
与|Φ^+⟩类似,不同之处在于两个量子态之间带有相对的负相位。
|Ψ^+⟩ = \frac{1}{\sqrt{2}} (|01⟩ + |10⟩)
这个状态表示第一个量子比特为0且第二个为1,以及第一个为1且第二个为0的叠加状态。
|Ψ^-⟩ = \frac{1}{\sqrt{2}} (|01⟩ – |10⟩)
类似 |Ψ^+⟩ ,但是两个量子态之间有负相位差。
Bell态的制备
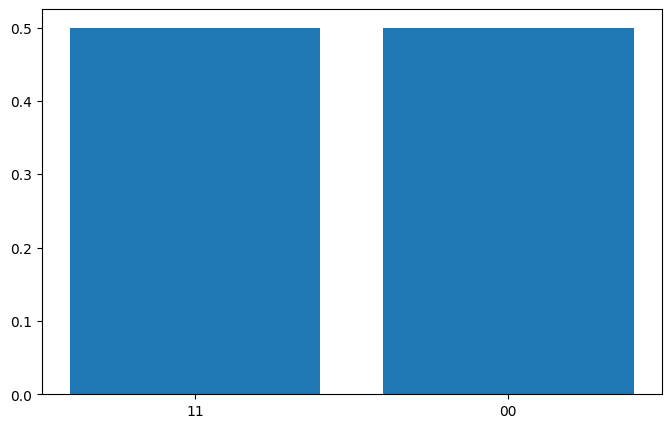
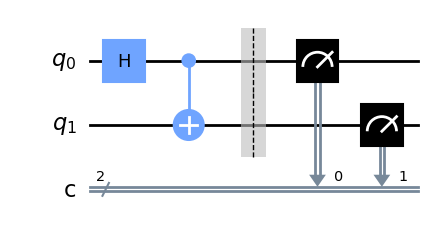
Bell态可以通过1个H门和1个CNOT门制备得到,线路如下:
import deepquantum as dq
import numpy as np
import matplotlib.pyplot as plt

cir = dq.QubitCircuit(2)
cir.h(0)
cir.cx(0,1)
cir.barrier()

cir()
res=cir.measure(with_prob= True) # 打印测量结果
print(res)

# 将数据分解为X和Y轴的值
labels = list(res.keys())
values = [value[1] for value in res.values()]

# 创建条形图
plt.figure(figsize=(8, 5))  # 设置图形大小
plt.bar(labels, values)  # 绘制条形图
{'11': (489, tensor(0.5000)), '00': (535, tensor(0.5000))}
画出对应的量子线路图
cir.draw()
GHZ态
GHZ态(Greenberger-Horne-Zeilinger态)是一种多体量子纠缠态,它在量子信息理论、量子计算和量子通信中具有重要的理论和应用价值。GHZ态是由Daniel Greenberger、Michael Horne和Anton Zeilinger在1989年提出的,用于展示多粒子系统中量子力学的非局域性。
GHZ态的定义
对于一个包含N个量子比特(qubits)的系统,GHZ态可以定义为如下的纠缠态:
|\text{GHZ}\rangle = \frac{1}{\sqrt{2}} (|0\rangle^{\otimes N} + |1\rangle^{\otimes N})
这里的 |0\rangle^{\otimes N} 表示所有N个量子比特都处于 |0\rangle 态,而 |1\rangle^{\otimes N} 表示所有N个量子比特都处于 |1\rangle 态。例如:
- 对于三个量子比特的GHZ态,表达式是:
- 对于四个量子比特的GHZ态,表达式是:
GHZ态的制备
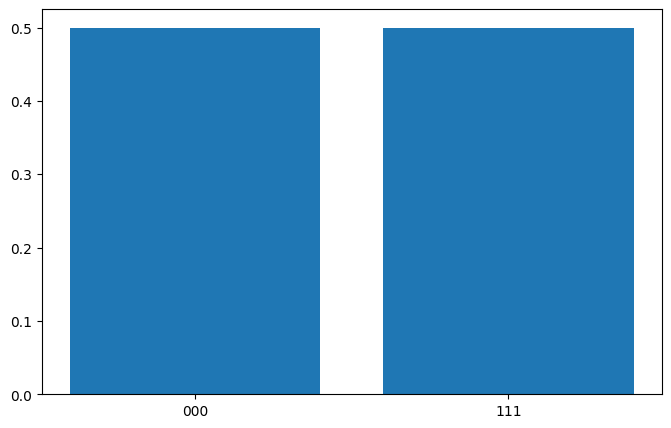
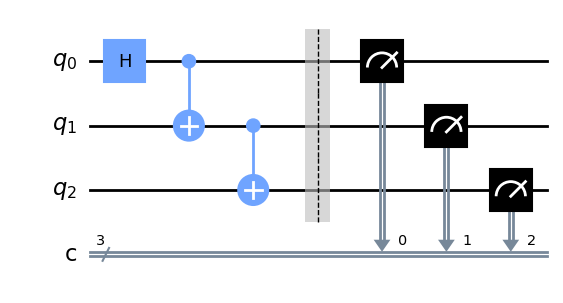
GHZ态可以通过1个H门和多个CNOT门制备得到,3-qubit GHZ态线路如下:
cir = dq.QubitCircuit(3)
cir.h(0)
cir.cx(0,1)
cir.cx(1,2)
cir.barrier()

cir()
res=cir.measure(with_prob= True) # 打印测量结果
print(res)

# 将数据分解为X和Y轴的值
labels = list(res.keys())
values = [value[1] for value in res.values()]

# 创建条形图
plt.figure(figsize=(8, 5))  # 设置图形大小
plt.bar(labels, values)  # 绘制条形图
{'000': (480, tensor(0.5000)), '111': (544, tensor(0.5000))}
画出对应的量子线路图
cir.draw()
c:\Users\HP\.conda\envs\dq\lib\site-packages\qiskit\visualization\circuit\matplotlib.py:266: FutureWarning: The default matplotlib drawer scheme will be changed to "iqp" in a following release. To silence this warning, specify the current default explicitly as style="clifford", or the new default as style="iqp".
  self._style, def_font_ratio = load_style(self._style)
更一般的情况,N-qubit GHZ态线路如下:
def GHZ_N(N):
    cir = dq.QubitCircuit(N)
    cir.h(0)
    for i in range(N-1):
        cir.cx(i,i+1)

    return cir
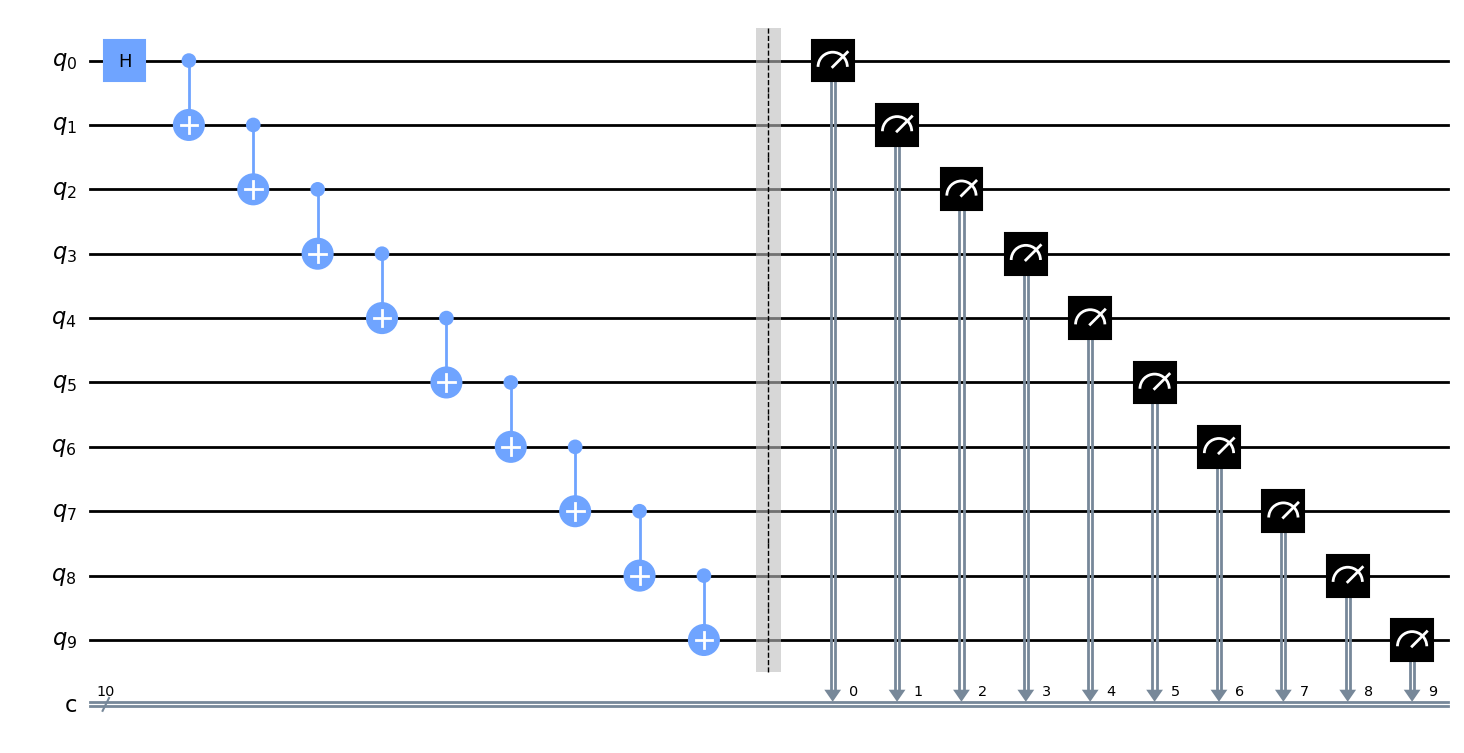
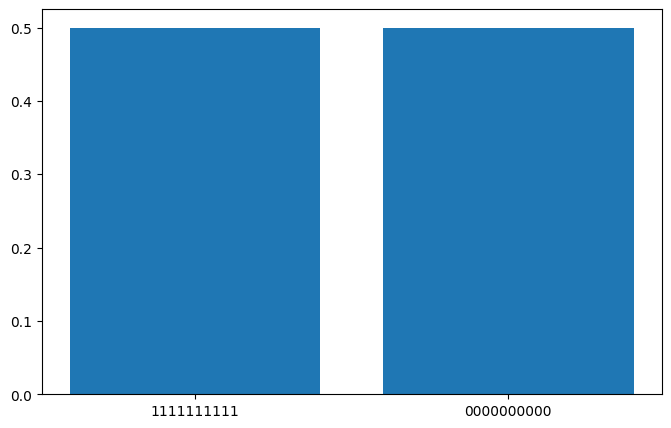
设置 N=10,我们可以观察生成的 N-qubit GHZ 态:
N=10
cir=GHZ_N(N)
cir.barrier()
cir()
res=cir.measure(with_prob= True) # 打印测量结果
print(res)

# 将数据分解为X和Y轴的值
labels = list(res.keys())
values = [value[1] for value in res.values()]

# 创建条形图
plt.figure(figsize=(8, 5))  # 设置图形大小
plt.bar(labels, values)  # 绘制条形图
{'1111111111': (525, tensor(0.5000)), '0000000000': (499, tensor(0.5000))}
画出对应的量子线路图
cir.draw()
c:\Users\HP\.conda\envs\dq\lib\site-packages\qiskit\visualization\circuit\matplotlib.py:266: FutureWarning: The default matplotlib drawer scheme will be changed to "iqp" in a following release. To silence this warning, specify the current default explicitly as style="clifford", or the new default as style="iqp".
  self._style, def_font_ratio = load_style(self._style)
